Plot connectivity-behavior scatter
plot_scatter.RdCreate scatter plots with optional linear regression lines for exploring connectivity-behavior relationships. Points, regression lines, and confidence bands can be toggled on or off, and their appearance can be customized through list arguments.
Arguments
- data
Data frame with one row per subject containing connectivity and behavioral/outcome columns
- x
Character string naming the x-axis column (typically a connectivity variable)
- y
Character string naming the y-axis column (typically a behavioral or outcome variable)
- group
Optional character string naming a grouping column. When provided, maps groups to color. When NULL (default), plots a single set of geoms
- colors
Optional color specification. When
groupis provided, a named character vector mapping group levels to colors (e.g.,c("YA" = "steelblue", "OA" = "coral")). Whengroupis NULL, a single color string applied to all geoms (e.g.,"steelblue")- show_points
Logical. If TRUE (default), display scatter points
- show_line
Logical. If TRUE (default), display linear regression lines with confidence bands
- point_args
Named list of additional arguments passed to
geom_point. Overrides defaults (alpha = 0.6). See Details- line_args
Named list of additional arguments passed to
geom_smoothcontrolling the regression line. Overrides defaults (linewidth = 1). See Details- band_args
Named list of additional arguments controlling the confidence band. Supports
se(logical, default TRUE),level(numeric, default 0.95), andalpha(numeric, default 0.2). See Details- clean_labels
Logical. If TRUE (default), clean column names for axis display by replacing underscores with hyphens and applying title case. If FALSE, use raw column names
- title
Optional character string for the plot title
Details
Regression lines are fitted with geom_smooth(method = "lm").
When group is provided, separate lines are fitted for each
group.
At least one of show_points or show_line must be TRUE.
The point_args, line_args, and band_args lists
are merged with internal defaults using utils::modifyList().
Defaults:
point_args:list(alpha = 0.6)line_args:list(linewidth = 1)band_args:list(se = TRUE, alpha = 0.2, level = 0.95)
Common point_args values include size, shape,
alpha, and color. See
geom_point for all options.
Common line_args values include linewidth,
linetype, color, and method (e.g.,
"loess"). See geom_smooth for all
options.
Band parameters se, level, and alpha must be
passed through band_args, not line_args. If found in
line_args, they are ignored with a warning.
colors is a convenience shortcut that applies a uniform color
to all layers. For per-layer control, use color or fill
inside the *_args lists instead. When both are specified,
*_args takes precedence over colors.
For grouped plots where points and bands need different shades per group, override the scales directly with standard ggplot2 syntax:
plot_scatter(df, x = "x", y = "y", group = "group") +
  scale_color_manual(values = c("YA" = "navy", "OA" = "darkred")) +
  scale_fill_manual(values = c("YA" = "lightblue", "OA" = "lightsalmon"))
Axis labels can always be overridden with + labs(x = ..., y = ...)
regardless of the clean_labels setting.
See also
plot_heatmap for connectivity matrix heatmaps.
plot_compare for group comparison bar plots.
Examples
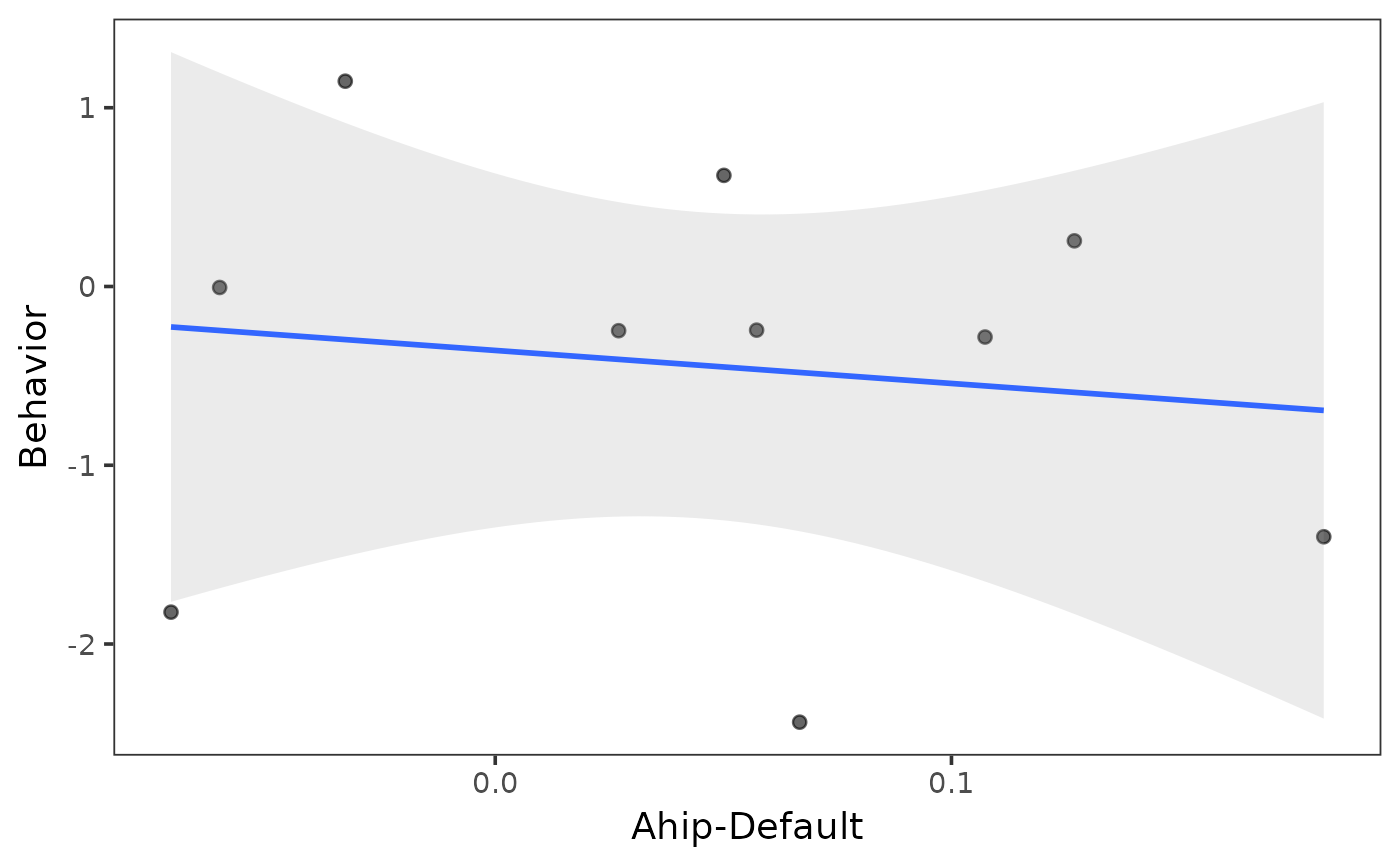
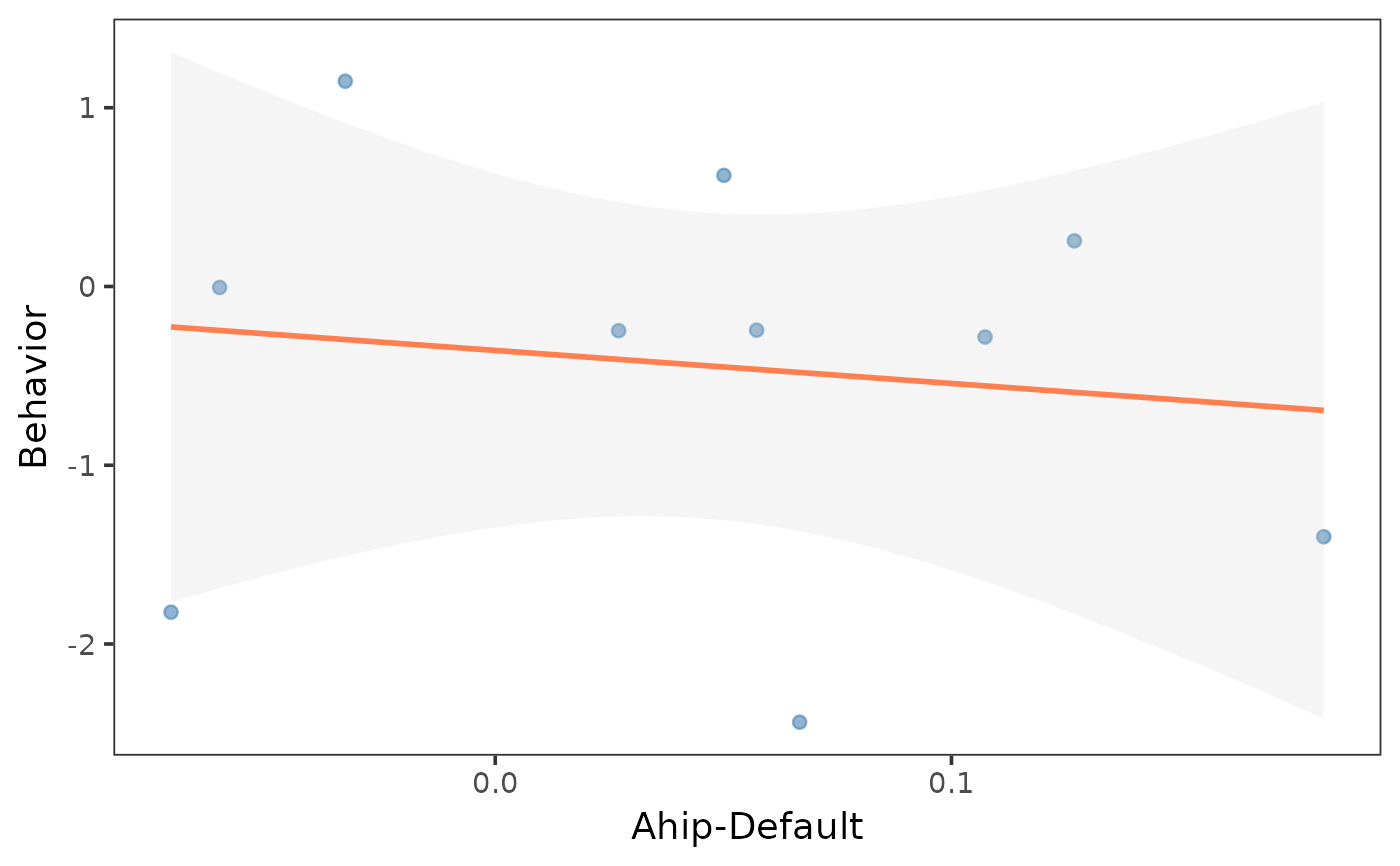
# Ungrouped scatter
indices <- get_indices(ex_conn_array)
ahip_df <- calc_conn(ex_conn_array, indices,
from = "ahip", to = "default"
)
ahip_df$behavior <- rnorm(10)
plot_scatter(ahip_df, x = "ahip_default", y = "behavior")
#> `geom_smooth()` using formula = 'y ~ x'
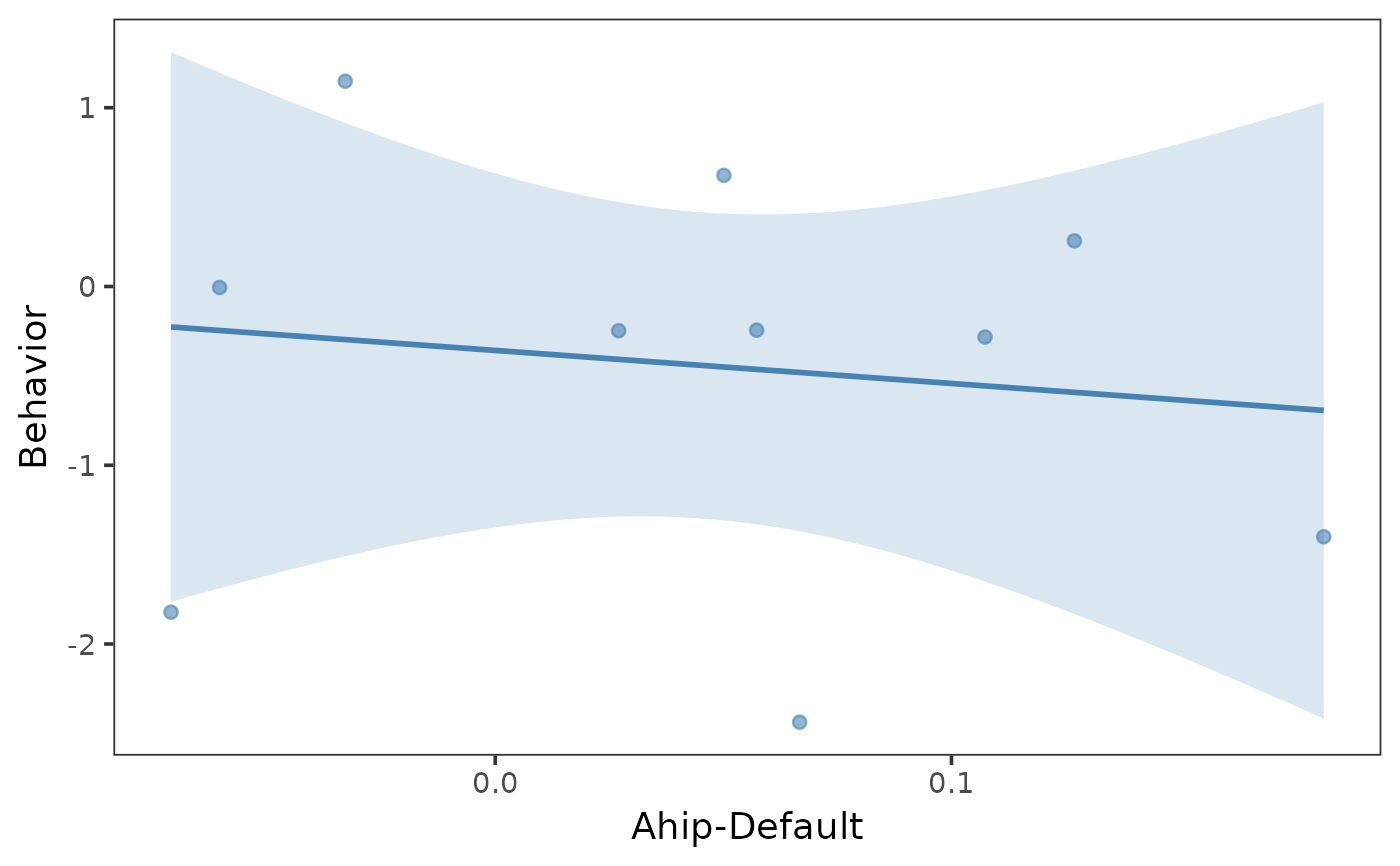
 # Ungrouped with a single color
plot_scatter(ahip_df, x = "ahip_default", y = "behavior",
colors = "steelblue"
)
#> `geom_smooth()` using formula = 'y ~ x'
# Ungrouped with a single color
plot_scatter(ahip_df, x = "ahip_default", y = "behavior",
colors = "steelblue"
)
#> `geom_smooth()` using formula = 'y ~ x'
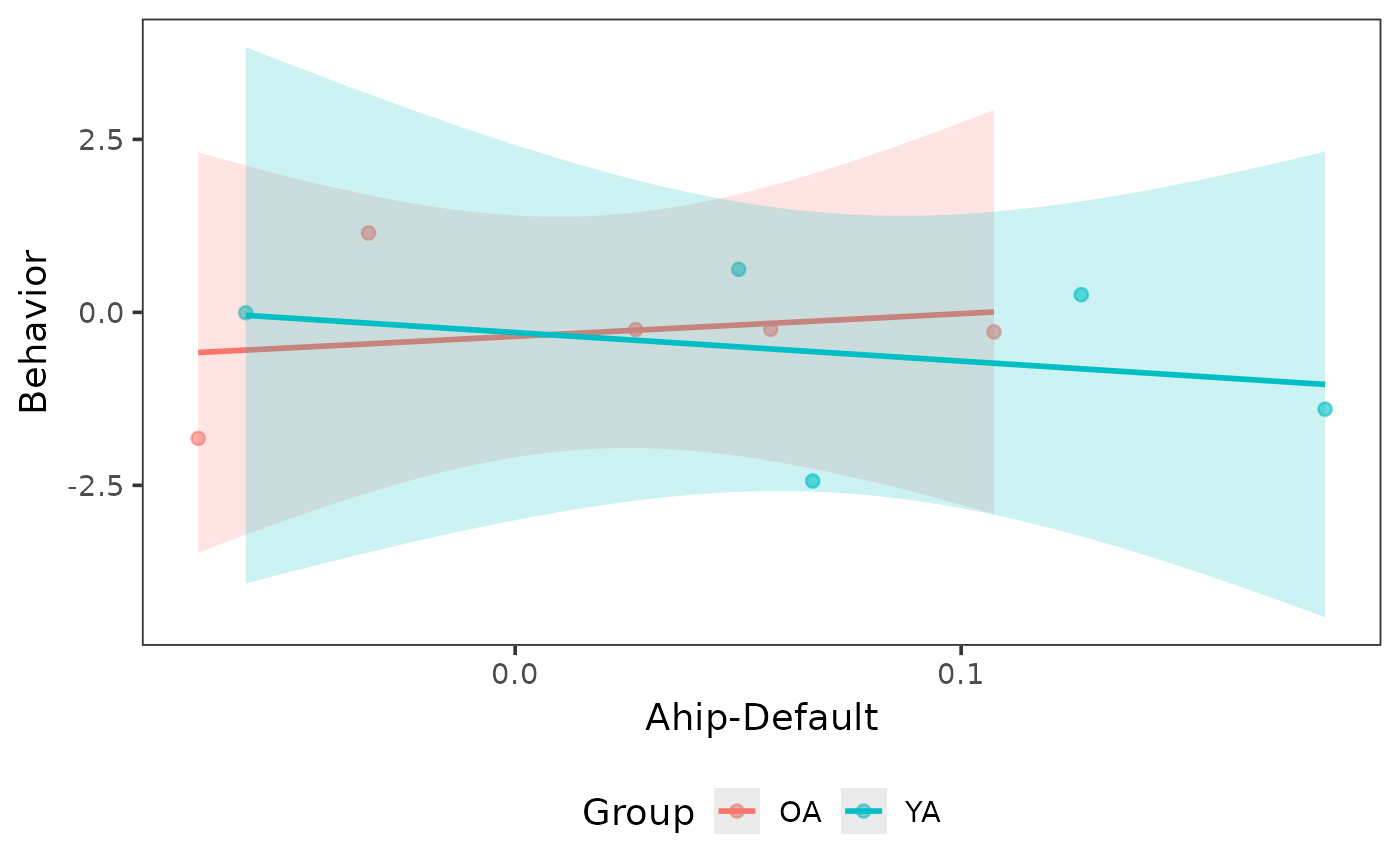
 # Grouped scatter
ahip_df$group <- rep(c("YA", "OA"), times = c(5, 5))
plot_scatter(ahip_df, x = "ahip_default", y = "behavior",
group = "group"
)
#> `geom_smooth()` using formula = 'y ~ x'
# Grouped scatter
ahip_df$group <- rep(c("YA", "OA"), times = c(5, 5))
plot_scatter(ahip_df, x = "ahip_default", y = "behavior",
group = "group"
)
#> `geom_smooth()` using formula = 'y ~ x'
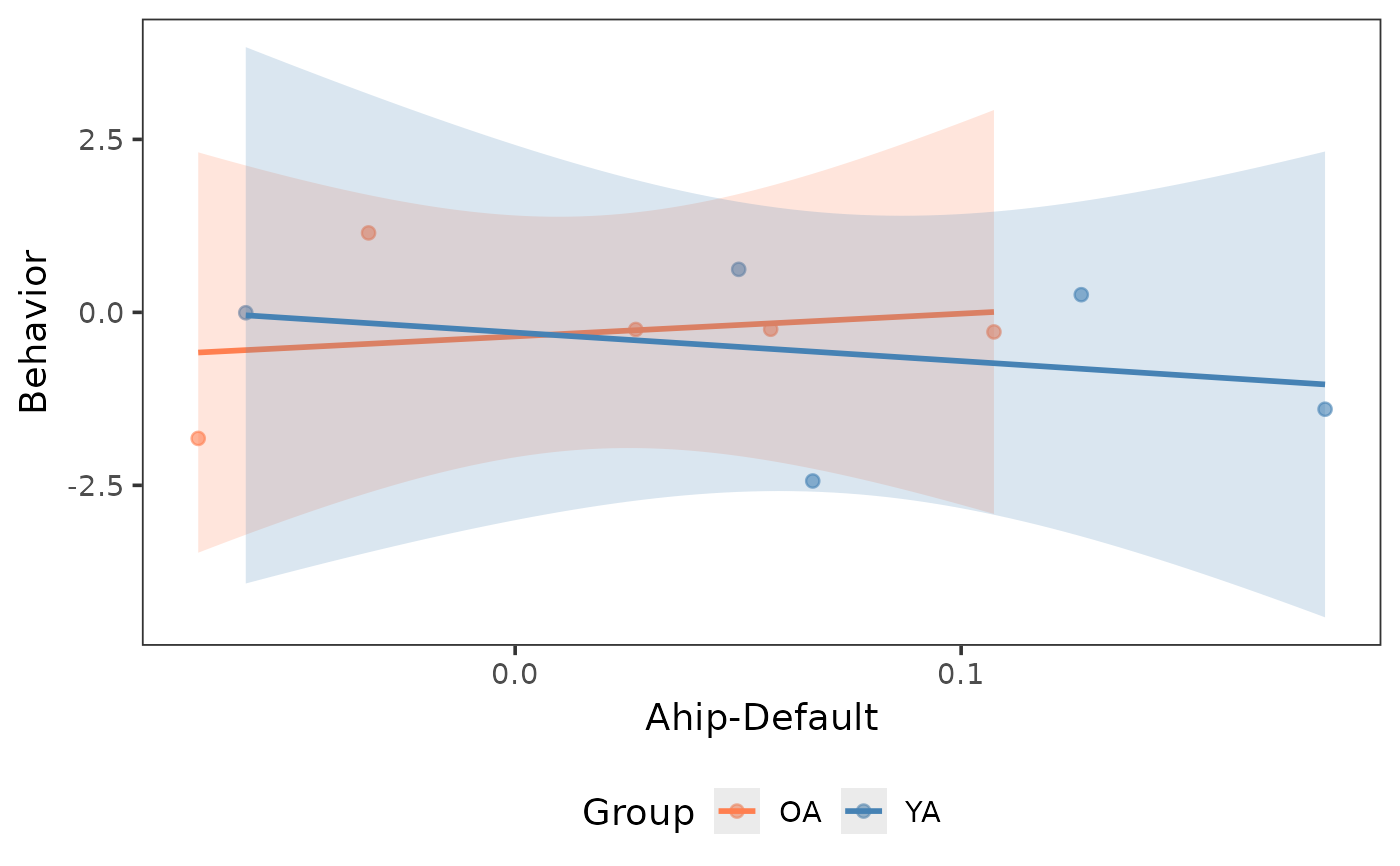
 # Custom group colors
plot_scatter(ahip_df, x = "ahip_default", y = "behavior",
group = "group",
colors = c("YA" = "steelblue", "OA" = "coral")
)
#> `geom_smooth()` using formula = 'y ~ x'
# Custom group colors
plot_scatter(ahip_df, x = "ahip_default", y = "behavior",
group = "group",
colors = c("YA" = "steelblue", "OA" = "coral")
)
#> `geom_smooth()` using formula = 'y ~ x'
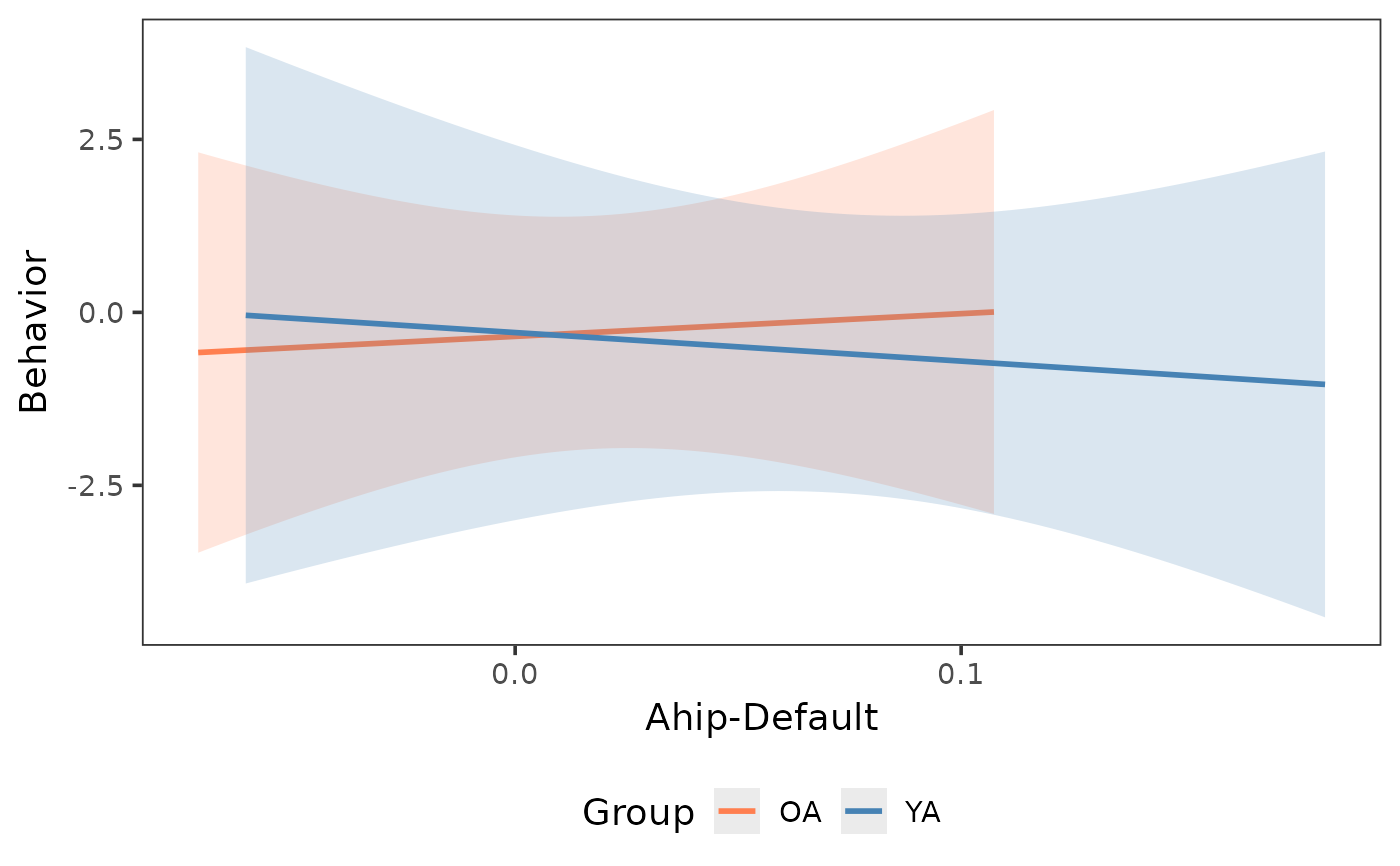
 # Lines and bands only (no points)
plot_scatter(ahip_df, x = "ahip_default", y = "behavior",
group = "group",
show_points = FALSE,
colors = c("YA" = "steelblue", "OA" = "coral")
)
#> `geom_smooth()` using formula = 'y ~ x'
# Lines and bands only (no points)
plot_scatter(ahip_df, x = "ahip_default", y = "behavior",
group = "group",
show_points = FALSE,
colors = c("YA" = "steelblue", "OA" = "coral")
)
#> `geom_smooth()` using formula = 'y ~ x'
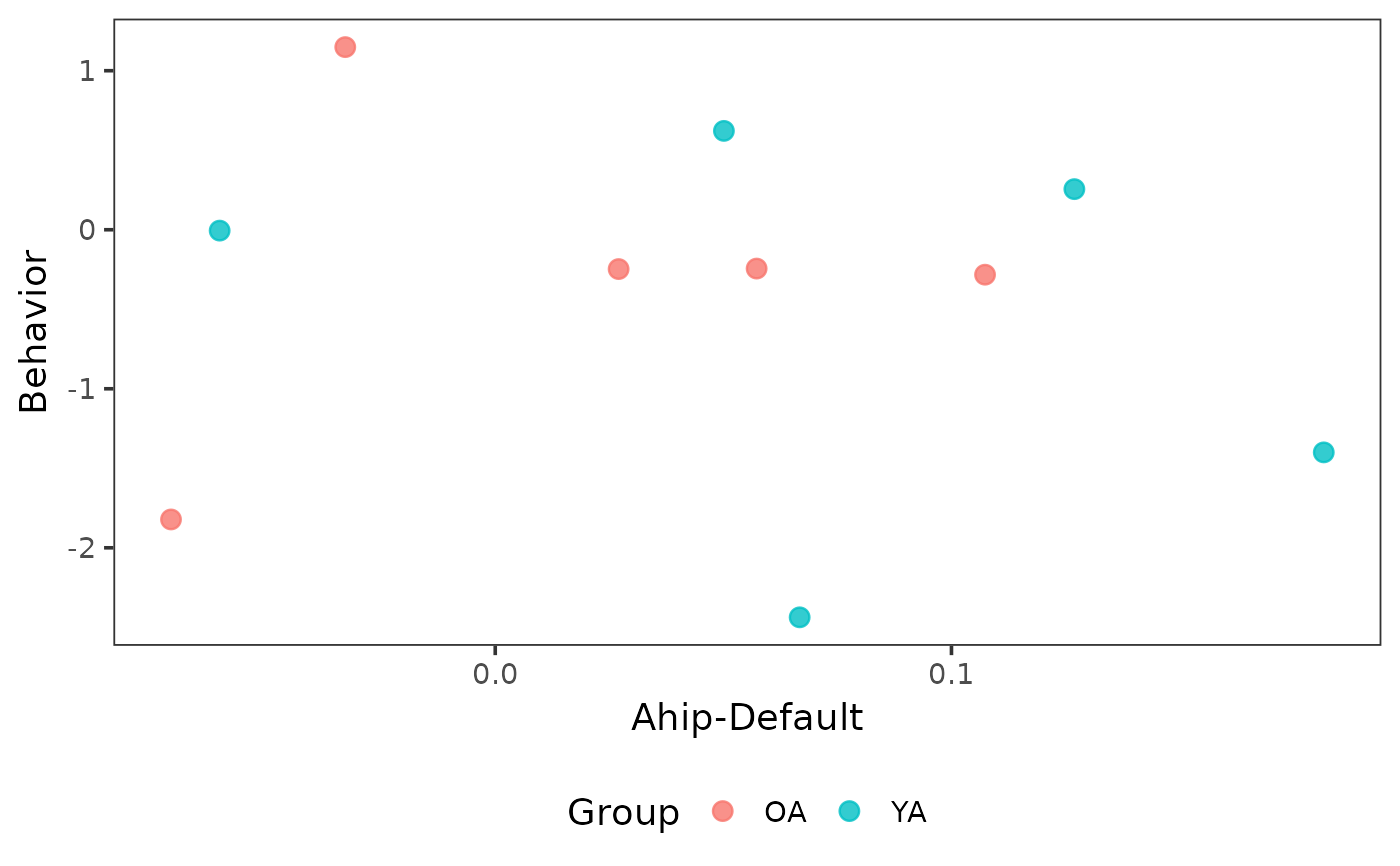
 # Points only (no line or band)
plot_scatter(ahip_df, x = "ahip_default", y = "behavior",
group = "group",
show_line = FALSE,
point_args = list(size = 3, alpha = 0.8)
)
# Points only (no line or band)
plot_scatter(ahip_df, x = "ahip_default", y = "behavior",
group = "group",
show_line = FALSE,
point_args = list(size = 3, alpha = 0.8)
)
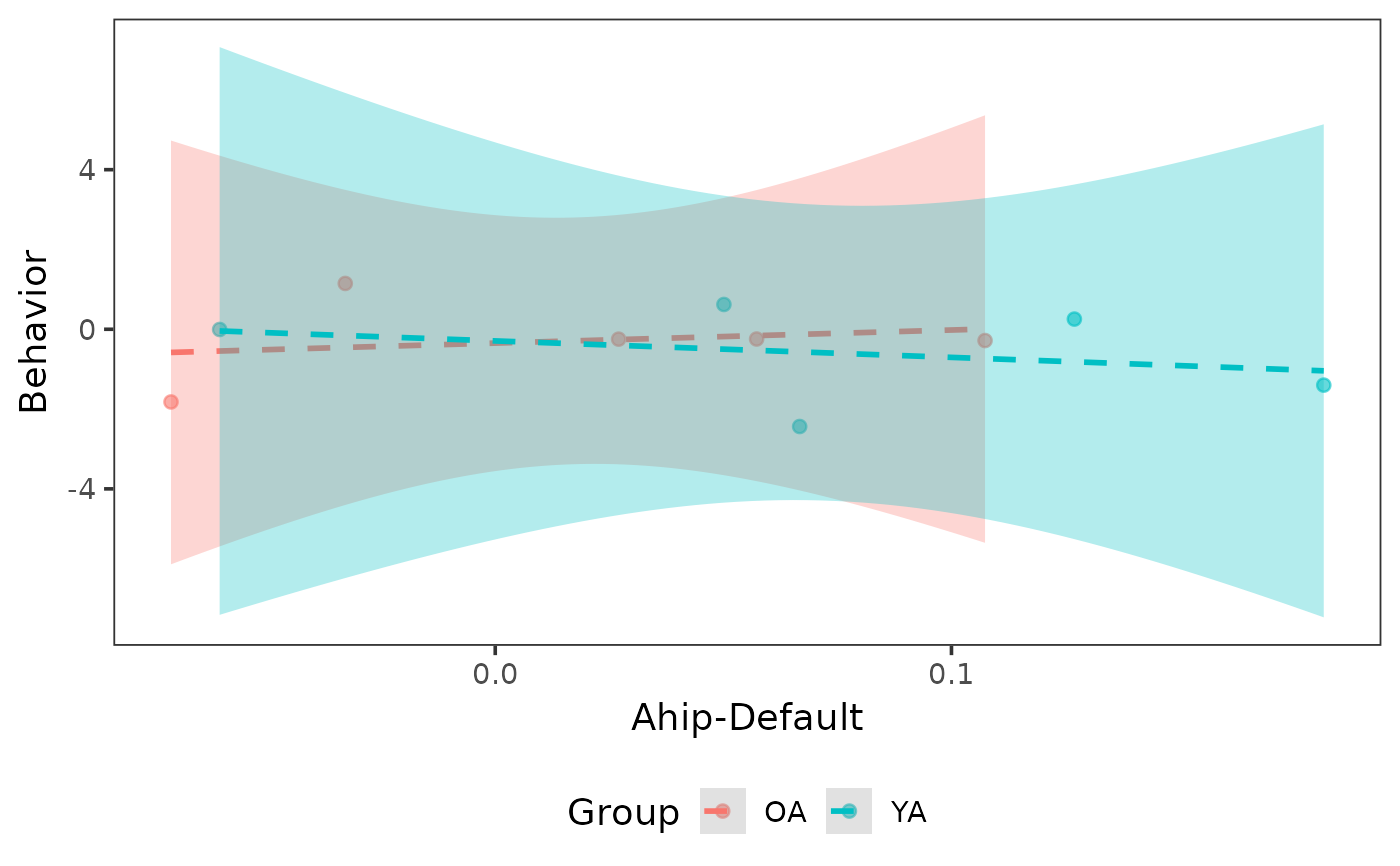
 # Custom line style and wider confidence band
plot_scatter(ahip_df, x = "ahip_default", y = "behavior",
group = "group",
line_args = list(linetype = "dashed"),
band_args = list(alpha = 0.3, level = 0.99)
)
#> `geom_smooth()` using formula = 'y ~ x'
# Custom line style and wider confidence band
plot_scatter(ahip_df, x = "ahip_default", y = "behavior",
group = "group",
line_args = list(linetype = "dashed"),
band_args = list(alpha = 0.3, level = 0.99)
)
#> `geom_smooth()` using formula = 'y ~ x'
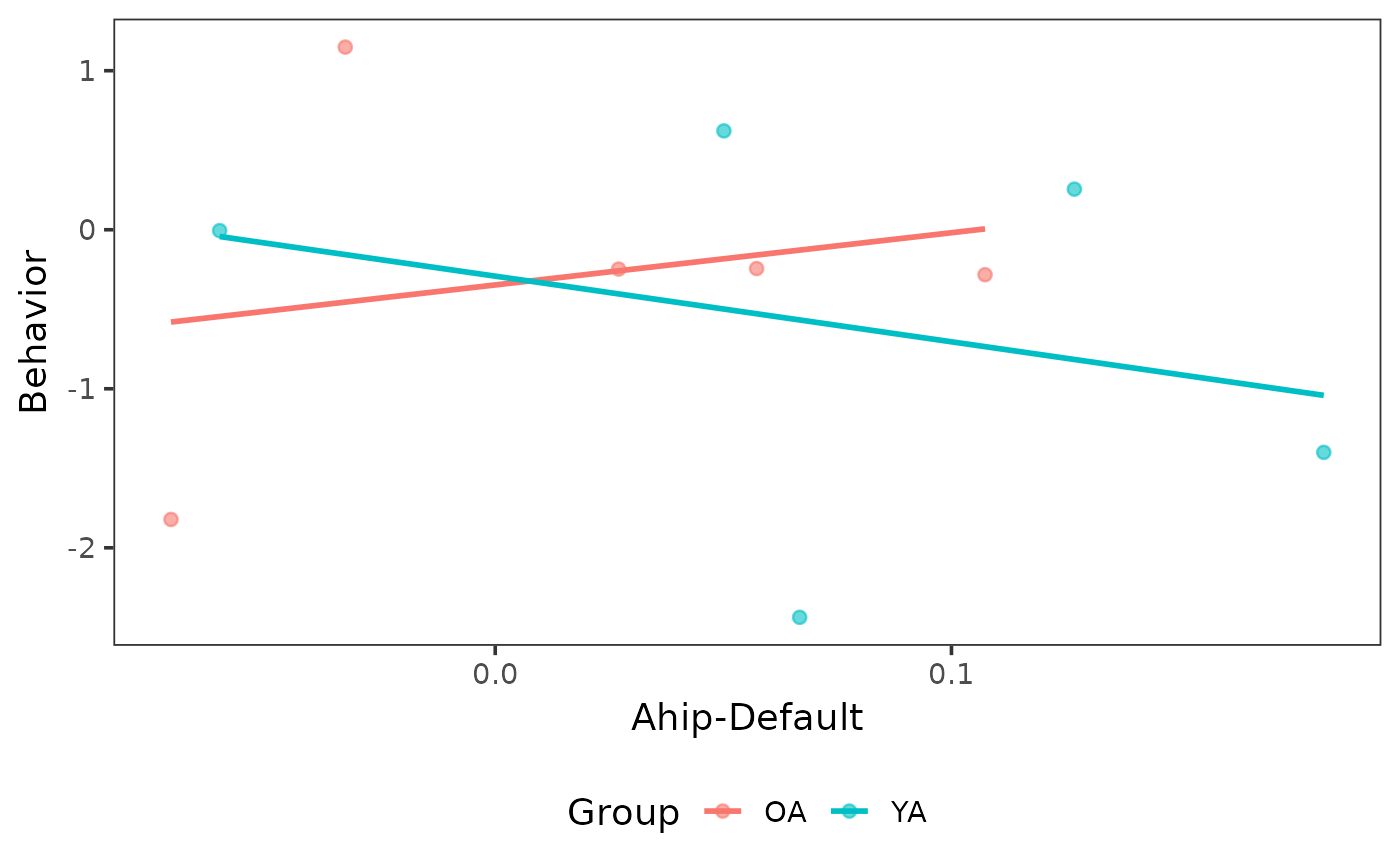
 # Disable confidence band
plot_scatter(ahip_df, x = "ahip_default", y = "behavior",
group = "group",
band_args = list(se = FALSE)
)
#> `geom_smooth()` using formula = 'y ~ x'
# Disable confidence band
plot_scatter(ahip_df, x = "ahip_default", y = "behavior",
group = "group",
band_args = list(se = FALSE)
)
#> `geom_smooth()` using formula = 'y ~ x'
 # Different colors for points, line, and band
plot_scatter(ahip_df, x = "ahip_default", y = "behavior",
point_args = list(color = "steelblue"),
line_args = list(color = "coral", fill = "grey80")
)
#> `geom_smooth()` using formula = 'y ~ x'
# Different colors for points, line, and band
plot_scatter(ahip_df, x = "ahip_default", y = "behavior",
point_args = list(color = "steelblue"),
line_args = list(color = "coral", fill = "grey80")
)
#> `geom_smooth()` using formula = 'y ~ x'
 if (FALSE) { # \dontrun{
# Full workflow with real data
z_mat <- load_matrices("data/conn.mat", type = "zmat", exclude = c(3, 5))
indices <- get_indices(z_mat)
ahip_nets <- calc_conn(z_mat, indices,
from = "ahip", to = c("default", "cont"))
df <- cbind(ahip_nets, demo[c("group", "memory")])
plot_scatter(df, x = "ahip_default", y = "memory", group = "group",
colors = c("YA" = "steelblue", "OA" = "coral"),
point_args = list(size = 2, shape = 17),
title = "AHIP-Default Connectivity on Memory"
)
} # }
if (FALSE) { # \dontrun{
# Full workflow with real data
z_mat <- load_matrices("data/conn.mat", type = "zmat", exclude = c(3, 5))
indices <- get_indices(z_mat)
ahip_nets <- calc_conn(z_mat, indices,
from = "ahip", to = c("default", "cont"))
df <- cbind(ahip_nets, demo[c("group", "memory")])
plot_scatter(df, x = "ahip_default", y = "memory", group = "group",
colors = c("YA" = "steelblue", "OA" = "coral"),
point_args = list(size = 2, shape = 17),
title = "AHIP-Default Connectivity on Memory"
)
} # }